07. Text: General Notes for Building Stories
Quick Note
The notes below are the general workflow for creating a story. If you are ready to practice for yourself, feel free to skip ahead to the next concept to the quiz and simply use this as a reference if you need it.
Stories
Stories are great for a narrated walkthrough of the discoveries you made in your data. They are similar to dashboards in that you create sheets, then drag the sheets to the story. However, each sheet is displayed separately along with narrative text in sequential series.
Below is a story I made looking into why the Global Superstore is losing money in some countries. You can download the workbook here or from the public story.
From this story, you can see that deep discounts are responsible for negative profits in a fairly large number of countries. The discounts aren't really helping growth there and the negative profits are getting worse over time. It might be a good idea to stop offering as many discounts there, or to leave the markets completely.
Creating a story
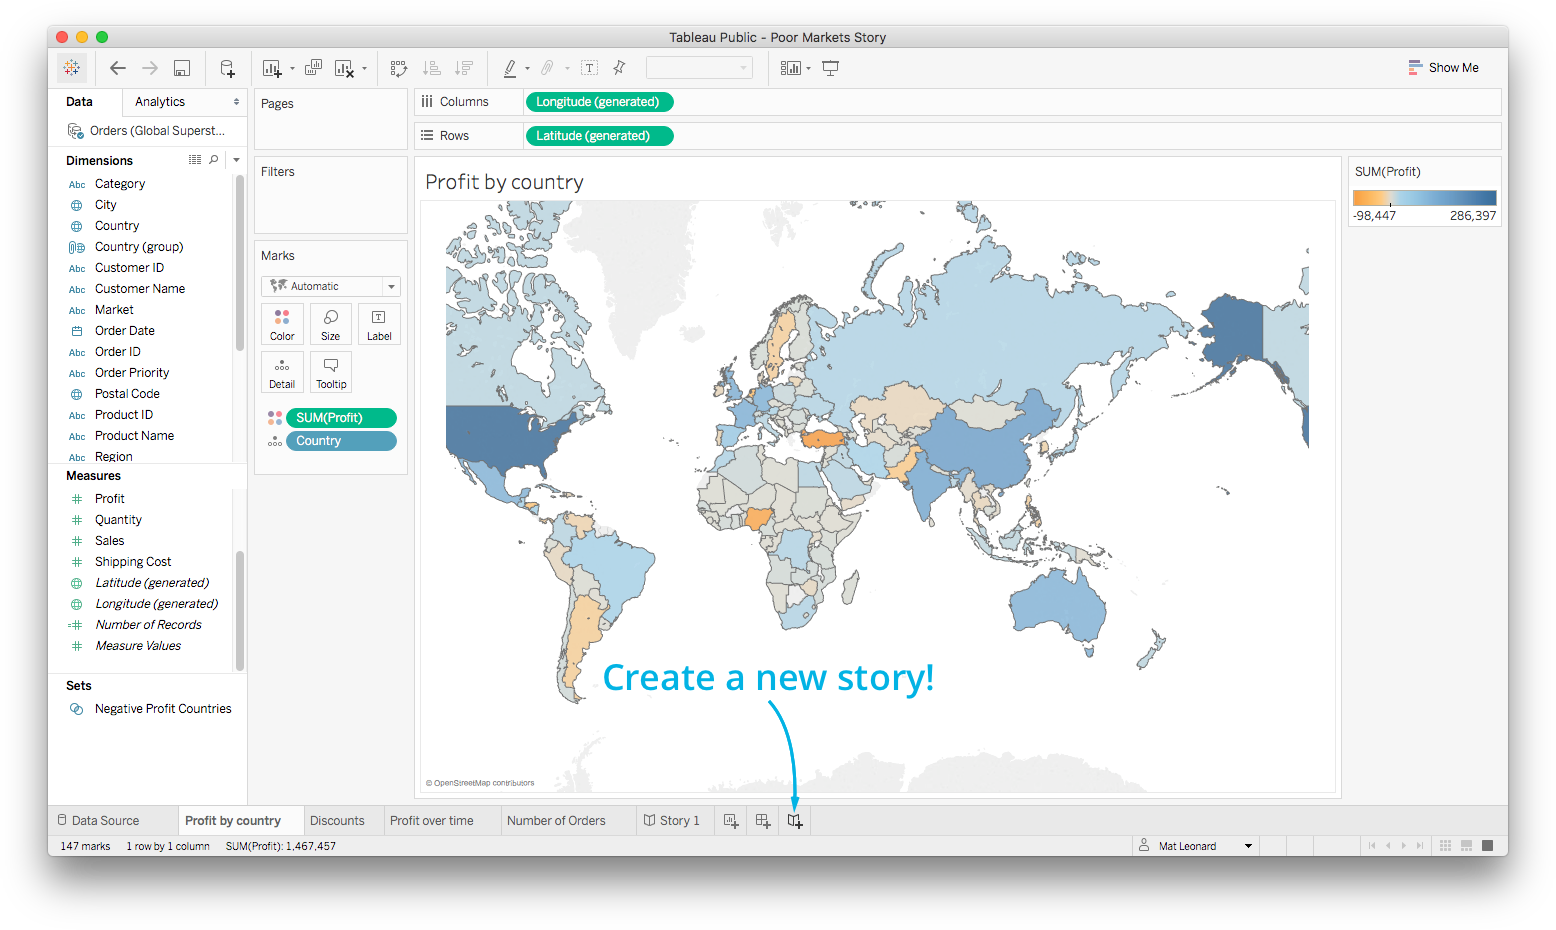
To create a new story, click on the "New Story" button at the bottom.

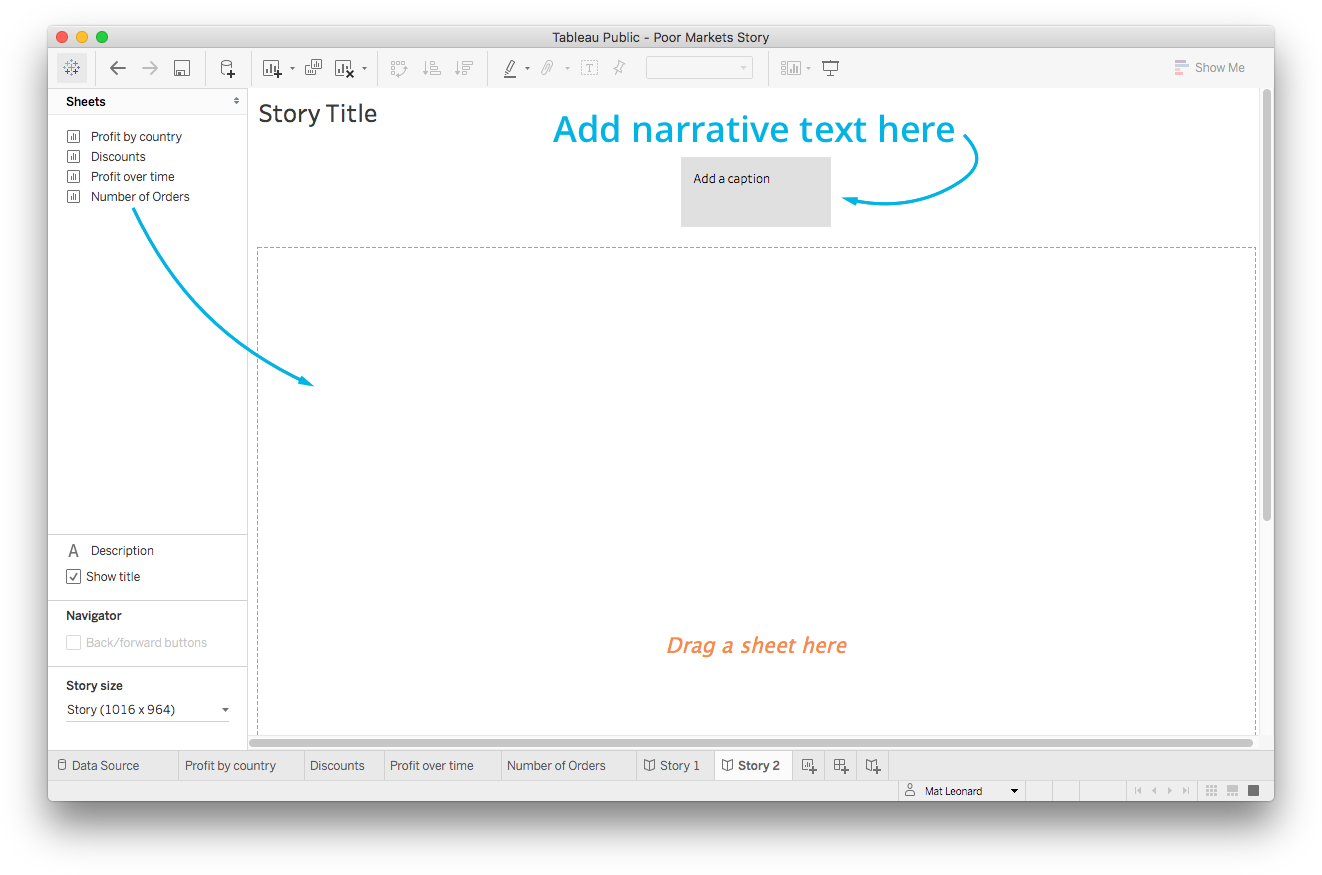
This brings up the story interface:

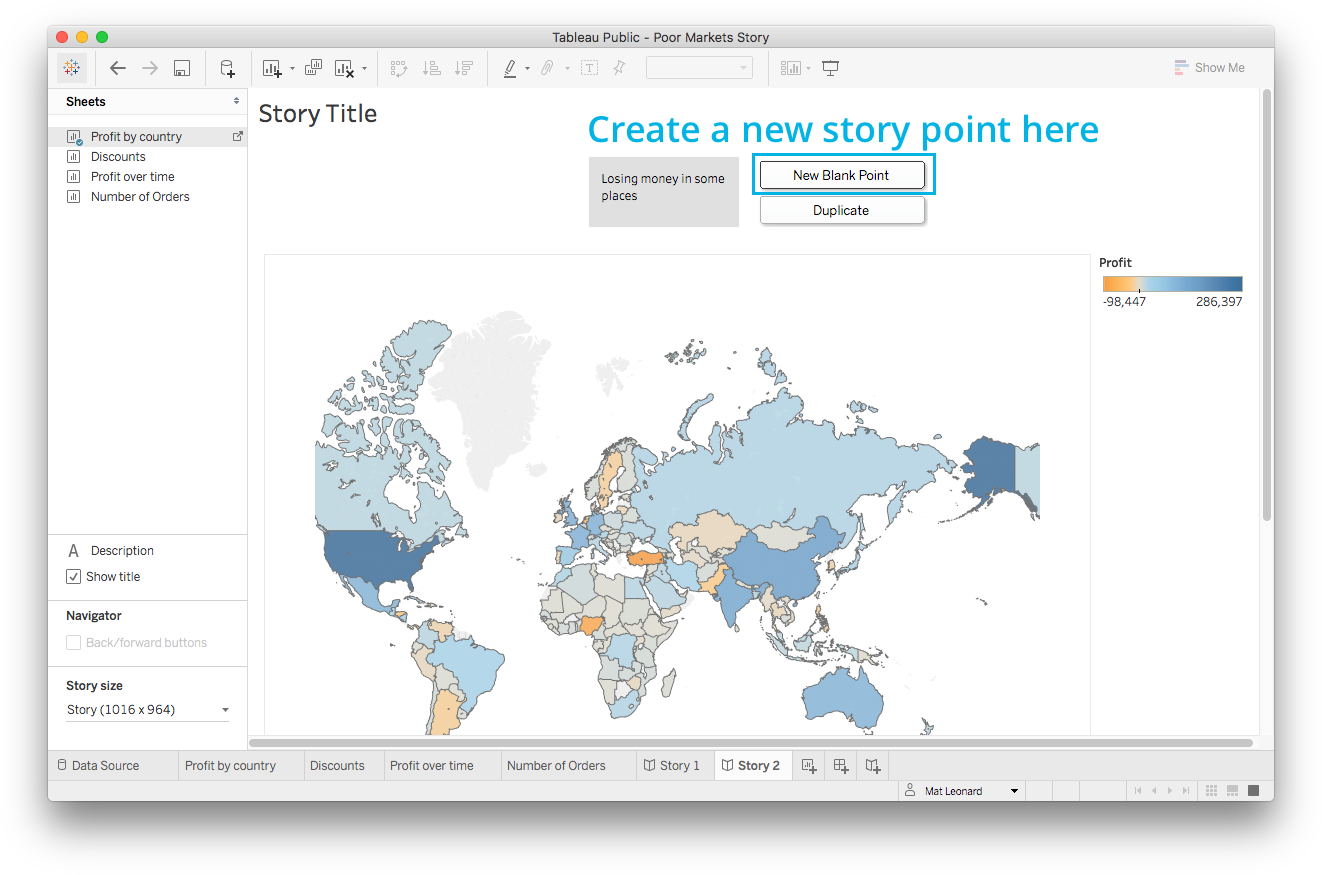
Here you drag a sheet to the view to create the first story point. In the grey box, you can add text to start the narrative. To create the next story point, click on "New Blank Point".

Stories allow you to give a personal flair to your presentation. This can be nice if you have a presentation that can occur all in Tableau, but often there are other parts of a presentation that you might want to use another tool. In which case, Tableau might not be the best option for these cases.
Additional information on stories can be found here:
- This tutorial video from Tableau.
- Documentation is here.
You will get hands on practice in the next concept.